4 Robustness Operating Models
The conflicting signals from the Brazilian–Uruguay and Chinese Taipei CPUE indices (Figure 2.3) are the dominant source of uncertainty influencing the estimates of stock status for South Atlantic Albacore.
To address this issue, two sets of Robustness Operating Models were developed with alternative treatments of these contrasting indices. For each Robustness OM set, one of the indices was assigned a likelihood weight (lambda) of zero, excluding it from contributing to the objective function during parameter estimation:
- R1: the Brazilian–Uruguay index was excluded from the likelihood
- R2: the Chinese Taipei index was excluded from the likelihood
For each of these two scenarios, the SS3 model was re-run for all 9 OMs in the uncertainty grid, resulting in two additional sets of 9 Robustness OMs alongside the Reference Set.
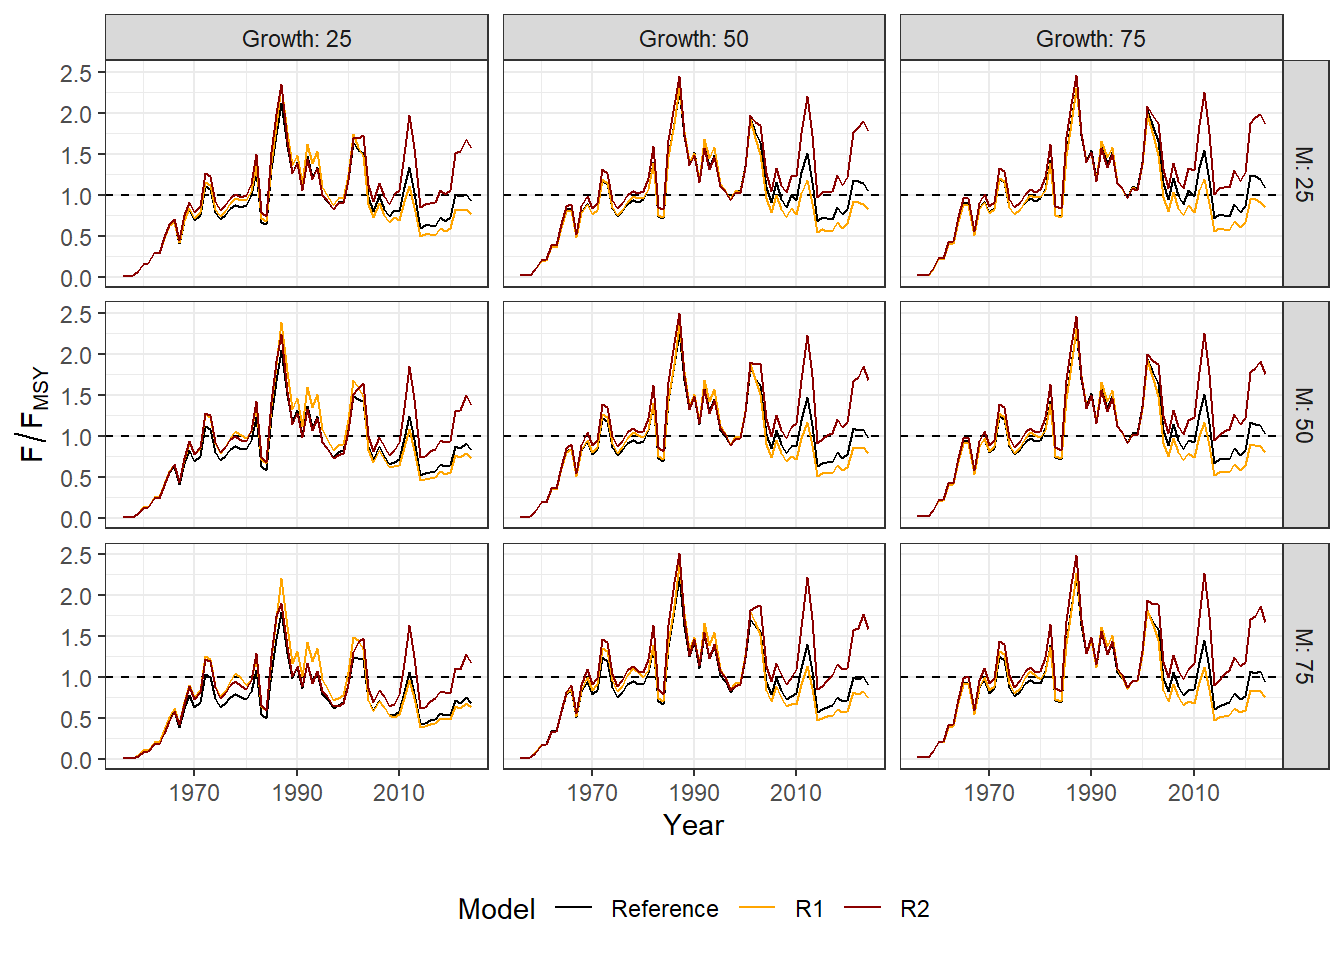
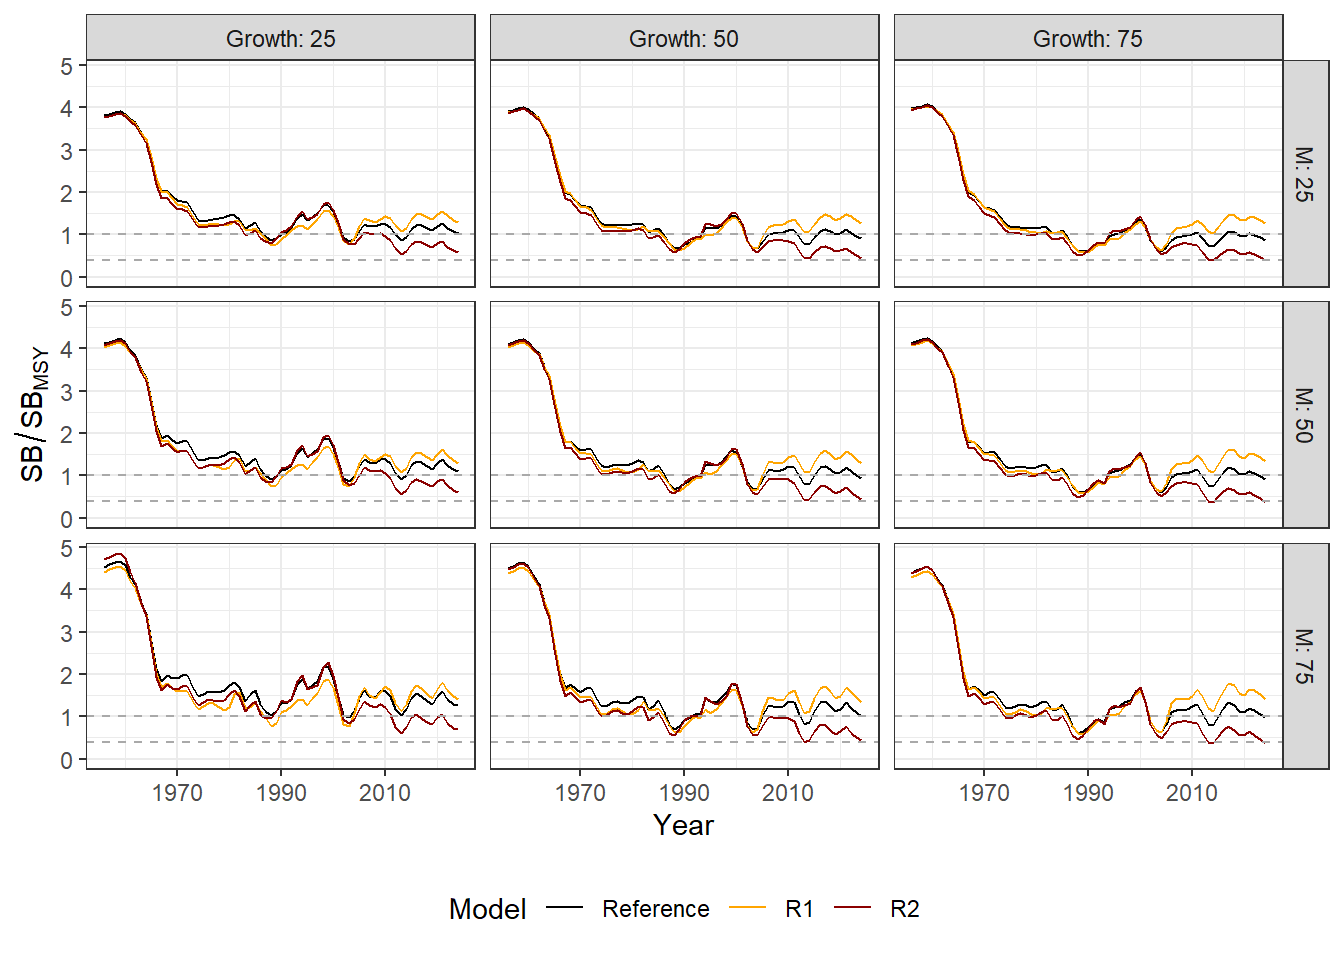
The figures below provide an overview of the population dynamics for the 9 OMs in each Robustness Set:
- Figure 4.1: historical spawning biomass relative to the MSY level
- Figure 4.2: historical fishing mortality relative to the \(F_\text{MSY}\)