2 Stock Assessment
The first age-structured stock assessment for South Atlantic Albacore was completed in June 2026, using the Stock Synthesis 3 (SS3) framework (Methot and Wetzel 2013). The assessment output was used as the basis for the Reference (Chapter 3) and Robustness (Chapter 4) operating models.
This chapter provides a brief overview of the assessment. For full details, see the Report of the 2026 ICCAT Albacore Stock Assessment Meeting and the Report of the 2026 ICCAT Albacore Data Preparatory Meeting.
The assessment model integrated total catches, standardized indices of abundance, and length-composition data covering the period 1956 – 2024.
2.1 Fleet Structure and Fishery Data
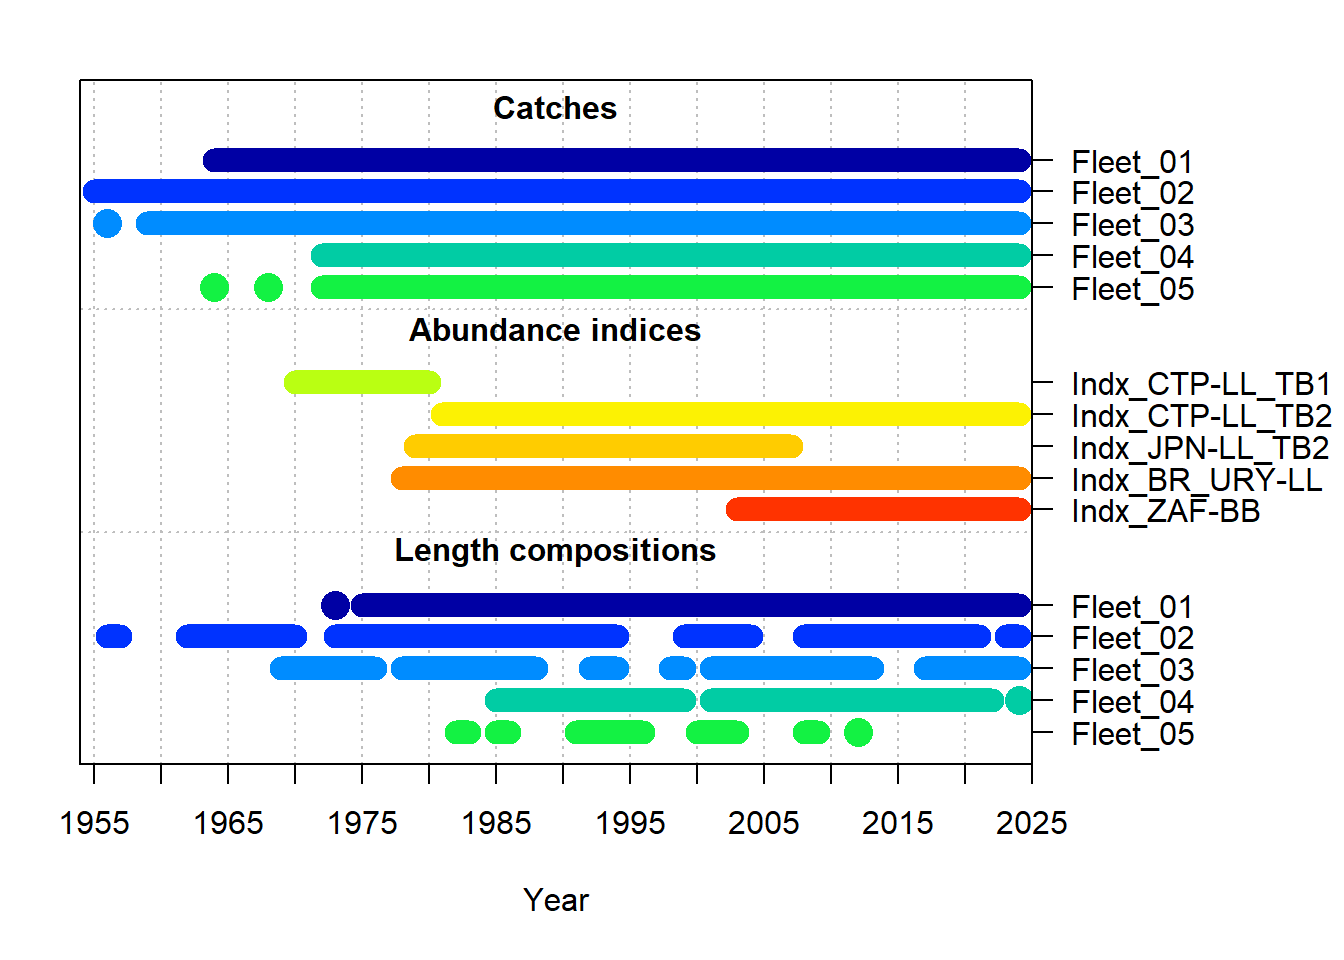
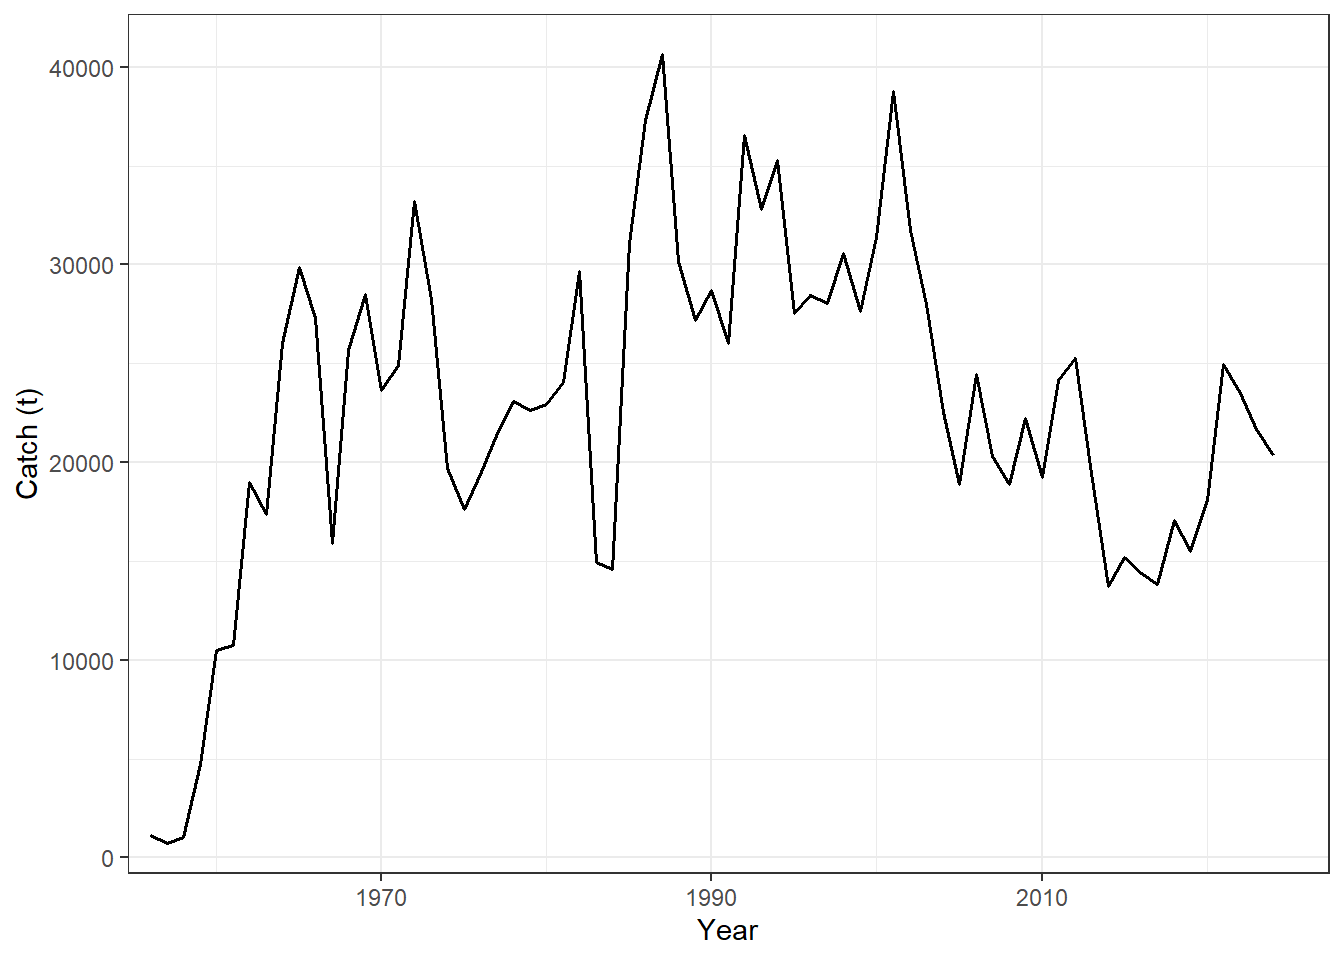
Five fishing fleets were defined by aggregating catch and length composition data for fishing fleets with similar properties (Table 2.1; Figure 2.1; Figure 2.2).
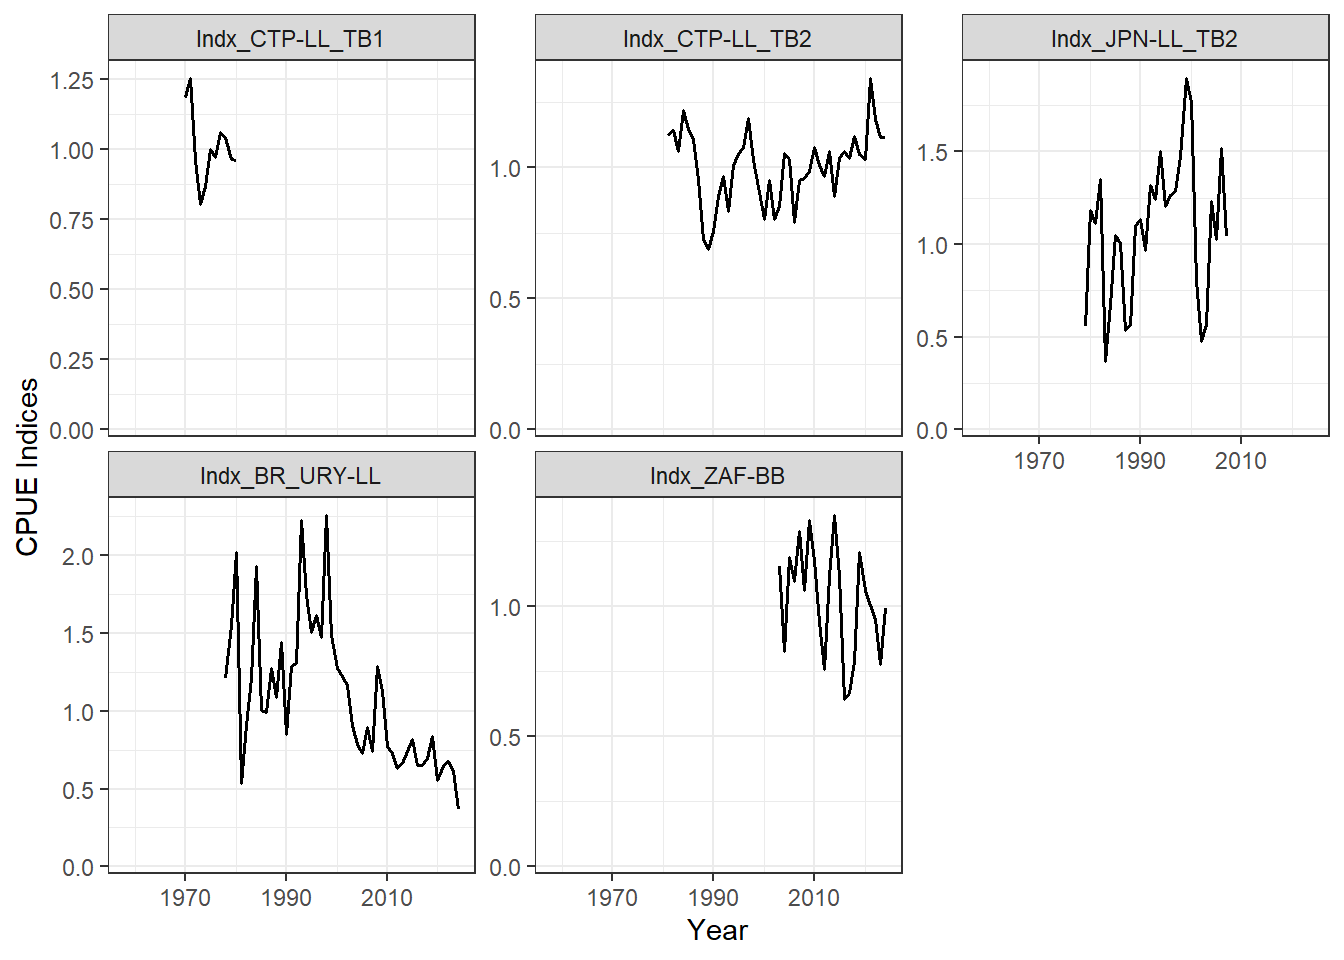
Five standardized CPUE indices were used in the Base Case assessment (Table 2.2; Figure 2.1; Figure 2.3).
The catch and CPUE data are imported into the Reference (Chapter 3) and Robustness (Chapter 4) operating models, and made available to the candidate management procedures (Chapter 7).
| Fleet | Definition (FlagName and Gear Group) | Catch | Size composition data | |
|---|---|---|---|---|
| Fleet 1 | Chinese Taipei (LL), Korea (LL) | 1964-2024 | up to 2024 | |
| Fleet 2 | Japan (LL), China (LL), EU-Spain (LL), EU-Portugal (LL), USA (LL), Philippines (LL), St Vincent and Grenadines (LL), Vanuatu (LL), Honduras (LL), NEI (LL), Côte D’Ivoire (LL), United Kingdom (LL), Seychelles (LL), UK.Sta Helena (LL), Angola (LL), Senegal (LL), Trinidad and Tobago (LL) | 1956-2024 | 1956-2024 | |
| Fleet 3 | Brazil (LL, SU), Uruguay (LL), Namibia (LL), Panama (LL), South Africa (LL, UN), Argentina (LL, TW, UN), Belize (LL), Cambodia (LL), Cuba (LL, UN) | 1959-2024 | 1969-2024 | |
| Fleet 4 | South Africa (BB, HL, PS, RR, SP) | 1973-2024 | 1980-2024 | |
| Fleet 5 | All others | 1961-2024 | 1961-2024 |
| Index Name | Definition | Years |
|---|---|---|
| Indx_CTP-LL_TB1 | Chinese Taipei longline, time block 1 | 1970-1980 |
| Indx_CTP-LL_TB2 | Chinese Taipei longline, time block 2 | 1981-2024 |
| Indx_JPN-LL_TB2 | Japan longline | 1979-2017 |
| Indx_BR_URY-LL | Brazil/Uruguay longline | 1978-2024 |
| Indx_ZAF-BB | South Africa baitboat | 2003-2024 |
2.2 Biological Parameters
The assessment model assumed age-specific natural mortality modelled with the Lorezen function (Lorenzen et al. 2022), mean length-at-age described by the von Bertalanffy growth model, and the stock-recruitment relationship modelled with the Beverton-Holt equation, parameterized with the ‘steepness’ (h) formulation.
Recruitment variability \(\left(\sigma_R\right)\) was fixed at 0.4 and h at 0.75. Maturity was specified as an at-age schedule with fish reaching 50% maturity at age 5 years and full maturity at 6 years.
See Table 5 in the Data Preparatory Report for a full list of the life-history parameters used in the model.
Uncertainty in the biological parameters was focused on alternative mean length-at-age and naturality mortality-at-age schedules. A set of nine models were developed combining three alternative growth parameterizations and three alternative natural mortality estimates corresponding to the 25th, 50th, and 75th percentiles of the distributions agreed at the Data Preparatory Meeting.
These nine models are used to create the Reference OM Grid (Chapter 3). The central model of this grid (model 5, referred to as S05) was used considered the Base Case assessment model and is used in the MSE as the Reference OM.